Generate
Create images with AI
2026 New Materials and Energy Research Guide
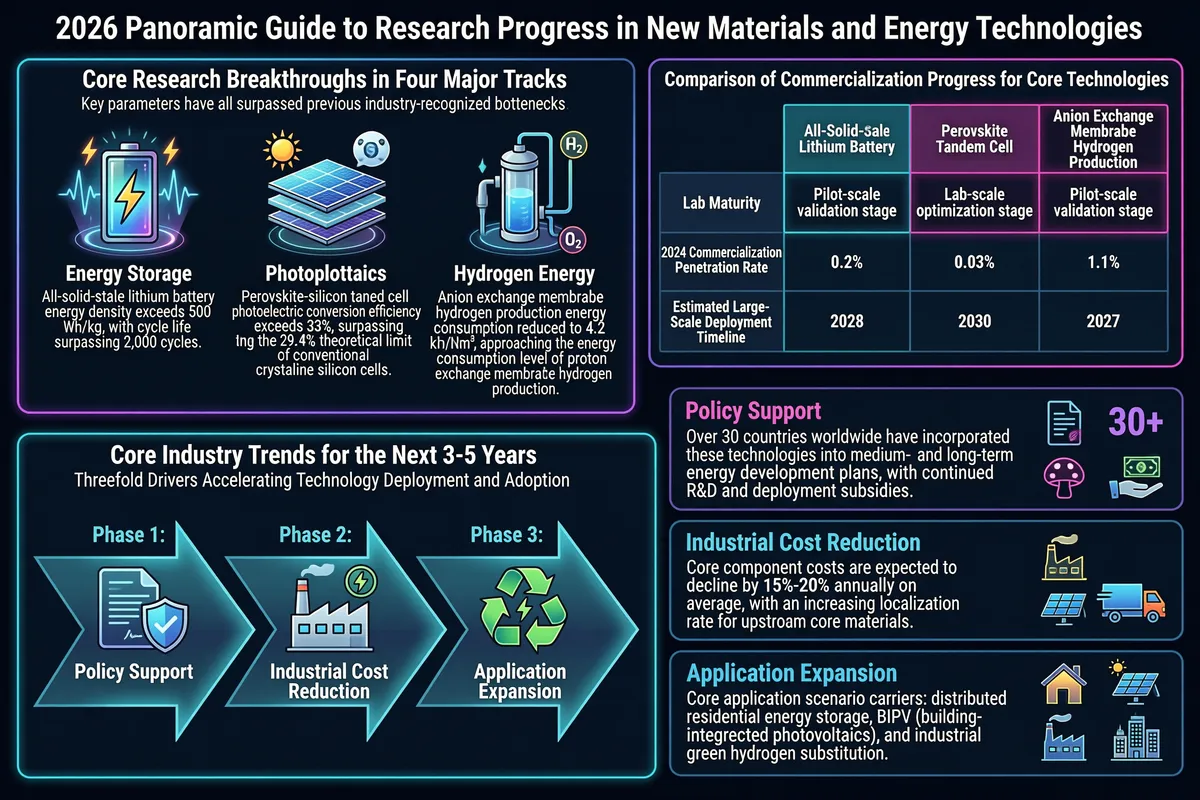
This infographic, titled "2026 Panoramic Guide to Research Progress in New Materials and Energy Technologies," uses a dark tech-style background with neon blue, purple, and pink tones outlining borders and text. The overall layout is clearly divided into four major sections, presenting core research breakthroughs, commercialization progress comparisons, 3-5 year industry trends, and supporting ecosystem factors. The upper-left section is titled "Core Research Breakthroughs in Four Major Tracks," with a subtitle stating "Key parameters have all surpassed previous industry-recognized bottlenecks." This area contains three side-by-side icon-based modules, each with illustrations and detailed data: 1. **Energy Storage**: - Illustration: A glowing battery device with lightning symbols and waveform lines. - Text: "All-solid-state lithium battery energy density exceeds 500 Wh/kg, with cycle life surpassing 2,000 cycles." 2. **Photovoltaics**: - Illustration: A multi-layered solar panel structure with a sun icon at the top. - Text: "Perovskite-silicon tandem cell photoelectric conversion efficiency exceeds 33%, surpassing the 29.4% theoretical limit of conventional crystalline silicon cells." 3. **Hydrogen Energy**: - Illustration: A water electrolysis hydrogen production device schematic, labeled with H₂ and O₂ gas outputs. - Text: "Anion exchange membrane hydrogen production energy consumption reduced to 4.2 kWh/Nm³, approaching the energy consumption level of proton exchange membrane hydrogen production." The upper-right section is titled "Comparison of Commercialization Progress for Core Technologies," presenting the performance of three technologies across different dimensions in a table format: | Dimension | All-Solid-State Lithium Battery | Perovskite Tandem Cell | Anion Exchange Membrane Hydrogen Production | |-----------------------|---------------------------------|------------------------|----------------------------------------------| | Lab Maturity | Pilot-scale validation stage | Lab-scale optimization stage | Pilot-scale validation stage | | 2024 Commercialization Penetration Rate | 0.2% | 0.03% | 1.1% | | Estimated Large-Scale Deployment Timeline | 2028 | 2030 | 2027 | The lower-left section is titled "Core Industry Trends for the Next 3-5 Years," with a subtitle "Threefold Drivers Accelerating Technology Deployment and Adoption," presented through three arrow-linked icon flowcharts: - Phase 1: Policy Support (icons of documents and shields) - Phase 2: Industrial Cost Reduction (icon of a factory) - Phase 3: Application Expansion (icon of a recycling/charging symbol) The lower-right section contains three independent information modules: 1. **Policy Support**: - Title highlighted in pink neon font. - Content: "Over 30 countries worldwide have incorporated these technologies into medium- and long-term energy development plans, with continued R&D and deployment subsidies." - On the right side are a "30+" numerical badge and small icons including documents, a mushroom, money, and a hand passing currency. 2. **Industrial Cost Reduction**: - Title in cyan neon font. - Content: "Core component costs are expected to decline by 15%-20% annually on average, with an increasing localization rate for upstream core materials." - On the right side are factory and truck icons. 3. **Application Expansion**: - Title in blue neon font. - Content: "Core application scenario carriers: distributed residential energy storage, BIPV (building-integrated photovoltaics), and industrial green hydrogen substitution." - On the right side are icons for a house, solar panels, a factory, and urban buildings. The overall infographic features a modern design with strong visual impact, extensively using glowing lines, transparent panels, and tech-inspired elements. The data presentation is clear, and the logical hierarchy is well-structured, comprehensively covering the key advancements, commercialization pathways, and future development trends in new materials and energy technologies for 2026.
Tags
More Images