Generate
Create images with AI
Pour-Over Coffee Brewing Step-by-Step Guide
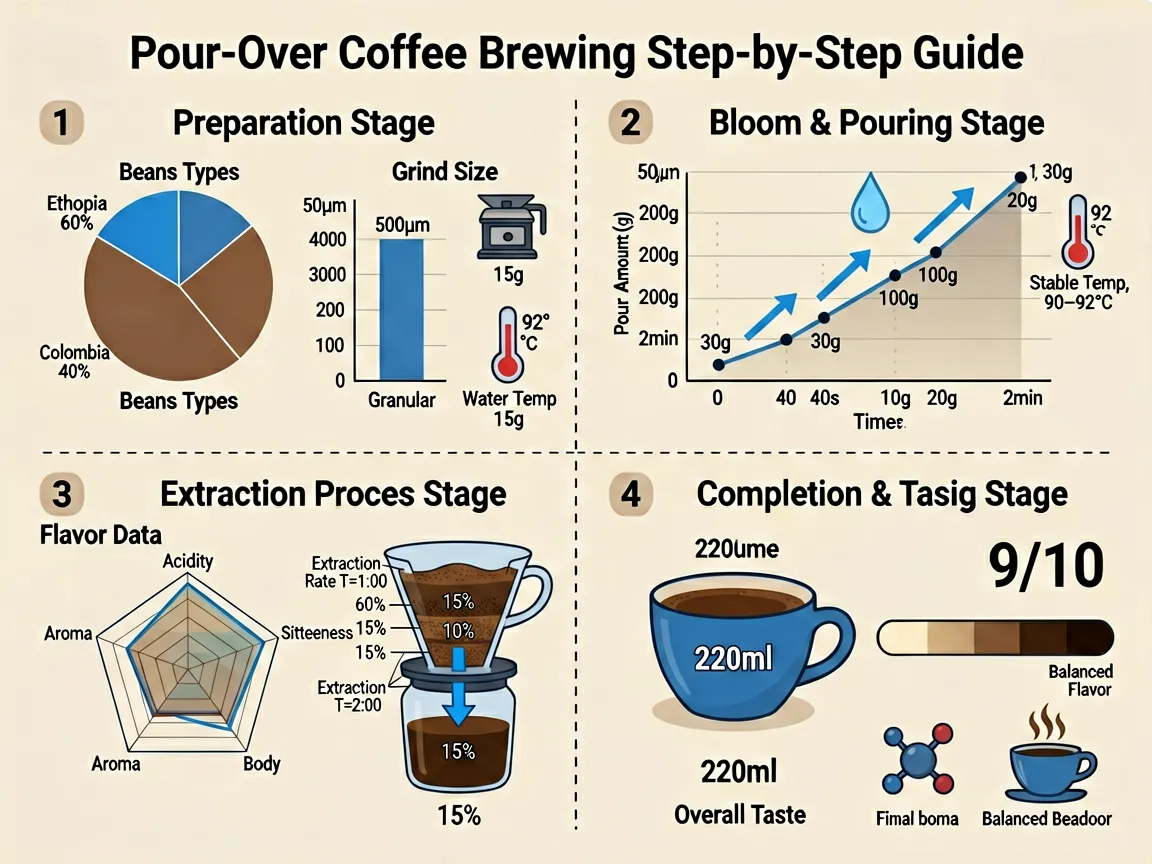
Background: Light beige background, illustrated layout. The overall composition is divided by dashed crosshairs into four quadrants, corresponding to the four main steps of pour-over coffee brewing. The title is centered at the top. Main Title: Pour-Over Coffee Brewing Step-by-Step Guide  Top-Left Quadrant: [1] Preparation Stage This section displays equipment and ingredient data. • Beans Types: Shown as a pie chart. ◦ Blue section: "Ethiopia 60%" ◦ Brown section: "Colombia 40%" • Grind Size: Shown as a bar chart. ◦ Vertical axis scale: 0 to 500μm ◦ Bar height reaches 500μm, with "500μm" labeled above and "Granular" labeled below. • Equipment Icons & Parameters: ◦ Grinder icon ◦ Scale icon (15g) ◦ Water Temp icon (92°C), with a thermometer display.  Top-Right Quadrant: [2] Bloom & Pouring Stage This section presents the extraction curve as a line chart. • Chart Structure: ◦ X-axis: Time ◦ Y-axis: Pour Amount (g) • Data Points & Phases: ◦ Start: (0, 0) ◦ Bloom (20g, 30s): The curve reaches 20g at 30s, with a flat pause at this point. A water droplet icon appears above. ◦ Continuous Pour (200g, 2min): From 30s onward, the curve continues to rise, passing through labeled points "30g" and "100g" (with blue upward arrows indicating trend), finally reaching 200g at 2min. • Side Icon: Thermometer icon labeled "Stable Temp, 90–92°C".  Bottom-Left Quadrant: [3] Extraction Process Stage This section displays flavor data and an extraction diagram. • Flavor Data: Shown as a radar chart with five dimensions (clockwise from top): ◦ Acidity ◦ Sweetness ◦ Body ◦ Bitterness ◦ Aroma The radar chart indicates that this coffee performs notably well in Aroma and Acidity. • Extraction Diagram: A cross-section of a dripper placed on a server. ◦ Inside the dripper, three layers are marked from top to bottom: 15%, 10%, 15%. ◦ Two time points are labeled on the left: "Extraction Rate T=1:00" and "Extraction Rate T=2:00". ◦ A blue arrow points downward through the coffee grounds, representing water flow. The liquid collected in the server is labeled "15%".  Bottom-Right Quadrant: [4] Completion & Tasting Stage This section shows the final brew and tasting indicators. • Final Volume (220ml): An illustration of a blue coffee cup with "220ml" marked on it. • Overall Taste: A score of "9/10" is shown in the upper right. Below it, a color gradient bar from light to dark is labeled on the right as "Balanced Flavor". • Bottom Icons: ◦ Aroma Molecules icon ◦ Steam icon (coffee cup with rising steam symbols)
Tags
More Images