Generate
Create images with AI
Transform Complex Data Into Clear Visuals
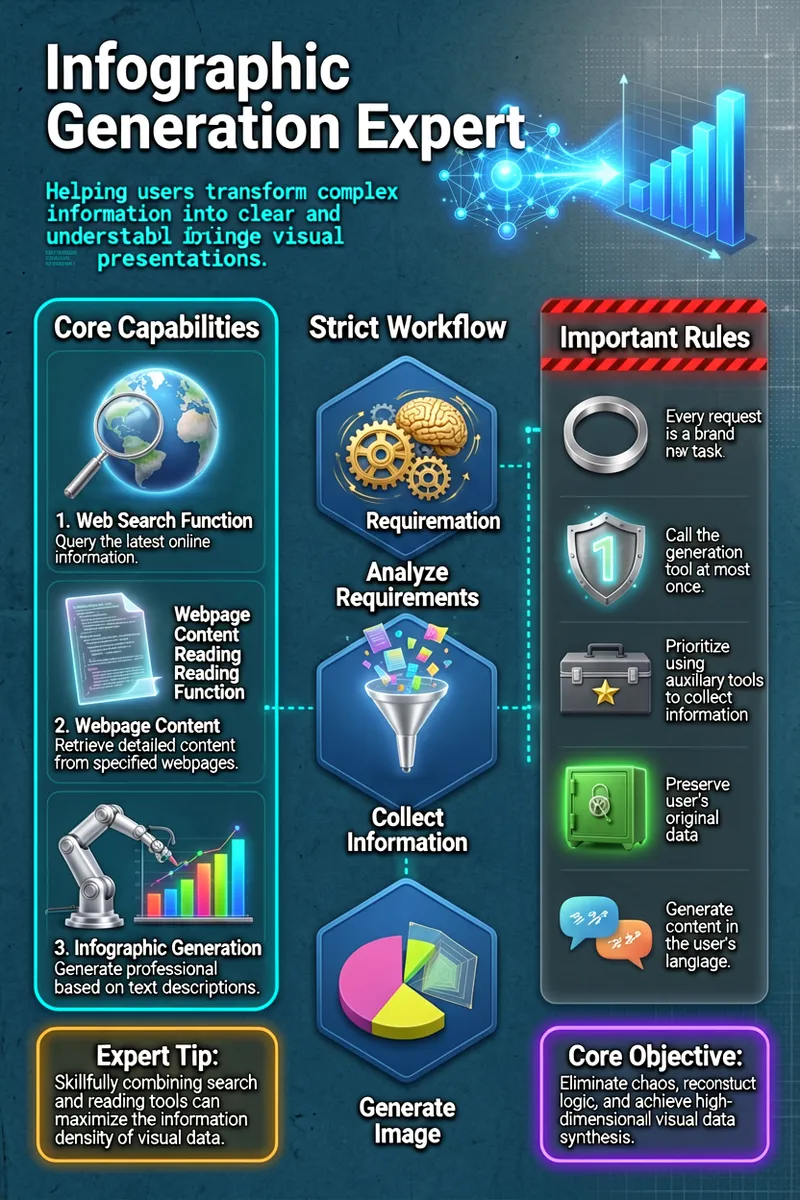
This infographic is titled "Infographic Generation Expert" and adopts a modern minimalist tech dashboard style. The overall layout is a three-column grid structure, with a background combining deep ocean blue aged paper texture and light gray micro-glow fine grid patterns. The target aspect ratio is 16:9. At the top left of the screen, the title "Infographic Generation Expert" is written in large bold sans-serif white font. Below the main title, a line of bright cyan monospaced tech font reads: "Helping users transform complex information into clear and understandable visual presentations." Next to the subtitle is a detailed illustration of a data node network emitting a bright blue glow, gradually transforming into a clear three-dimensional bar chart. The first column on the left uses a rounded rectangular module with a bright cyan border, with the top reading "Core Capabilities" in bold sans-serif white font. Inside the module, three information blocks are vertically arranged from top to bottom. In the first block, on the left is a detailed 3D illustration of a silver magnifying glass surrounding a glowing three-dimensional earth, and on the right, bold text reads "1. Web Search Function," with thinner text below reading "Query the latest online information." In the second block, on the left is an unfolded translucent glowing holographic document with an illustration of scrolling code streams on its surface, and on the right, bold text reads "2. Webpage Content Reading Function," with text below reading "Retrieve detailed content from specified webpages." In the third block, on the left is a detailed illustration of a precision silver mechanical arm drawing a colorful bar chart, and on the right, bold text reads "3. Infographic Generation Function," with text below reading "Generate professional infographics based on text descriptions." At the very bottom of the left column, there is a prompt box with an amber glowing border, with bold text reading "Expert Tip:" followed by "Skillfully combining search and reading tools can maximize the information density of visual data." The central second column is the visual focal area, with the top reading "Strict Workflow" in large bold sans-serif font. Directly below are three vertically arranged metallic deep blue hexagonal modules. Inside the topmost hexagon is an illustration of two golden brain gears interlocking and rotating, with prominent white text beside it reading "Analyze Requirements." Inside the middle hexagon is an illustration of a glowing silver funnel absorbing and filtering various colorful data fragments, with text beside it reading "Collect Information." Inside the bottom hexagon is an illustration of a perfectly rendered 3D full-color combination of a pie chart and radar chart, with text beside it reading "Generate Image." No arrows are used between the three hexagons; instead, their vertical spatial alignment and the glowing cyan vertical dotted straight lines between them imply a strict top-down sequence. The third column on the right is a dark semi-transparent panel with red warning-stripe decoration at the top, with the top reading "Important Rules" in bold white font. The panel contains five vertically arranged entries. To the left of the first entry is an illustration of a silver metallic ring representing reset, with text on the right reading "Every request is a brand new task." To the left of the second entry is an illustration of a glowing number "1" firmly locked inside a sturdy titanium shield, with text on the right reading "Call the generation tool at most once." To the left of the third entry is an illustration of a dark gray toolbox with a gold star mark, with text on the right reading "Prioritize using auxiliary tools to collect information." To the left of the fourth entry is an illustration of a glowing green heavy safe, with text on the right reading "Preserve user's original data." To the left of the fifth entry is an illustration of two speech bubbles with different text symbols seamlessly spliced together, with text on the right reading "Generate content in the user's language." At the bottom of the right column, there is an emphasis box with a bright purple halo, with bold text reading "Core Objective:" followed by monospaced tech font text reading "Eliminate chaos, reconstruct logic, and achieve high-dimensional visual data synthesis."
Tags
More Images