Generate
Create images with AI
Understanding the Fast Fourier Transform Infographic
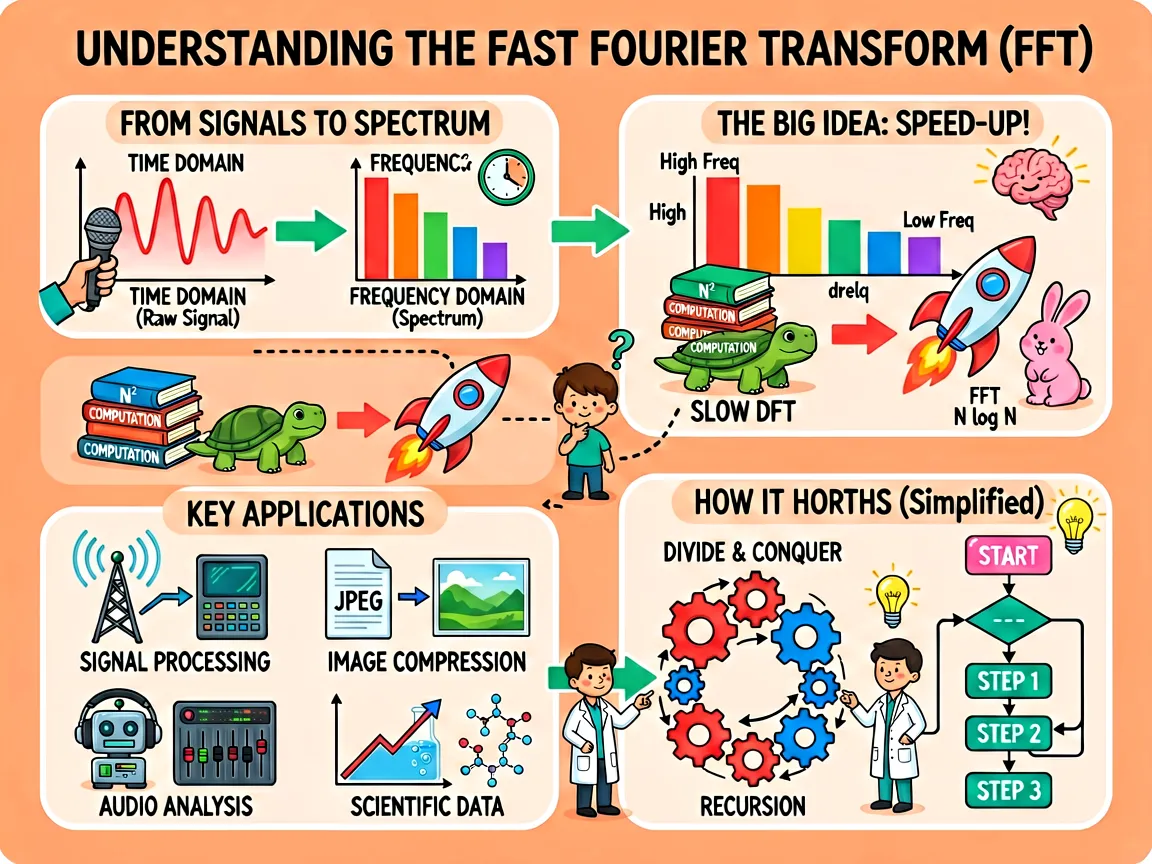
The infographic titled "UNDERSTANDING THE FAST FOURIER TRANSFORM (FFT)" is presented in a colorful, cartoon-style layout with a warm peach-orange background and white borders around each section. The design uses playful illustrations, dashed arrows to indicate flow, and rounded rectangular boxes to organize content into distinct sections. The infographic is structured into four main sections, arranged in a clockwise flow starting from the top left: 1. **FROM SIGNALS TO SPECTRUM** This section explains the transformation from time-domain signals to frequency-domain spectra. - On the left: “TIME DOMAIN (Raw Signal)” is depicted as a wavy red line graph resembling an audio waveform, accompanied by a hand holding a microphone and a clock icon, symbolizing time-based data. - On the right: “FREQUENCY DOMAIN (Spectrum)” is shown as a bar chart with vertical bars of varying heights and colors (red, orange, yellow, green, blue, purple) decreasing from left to right, labeled “High Freq” at the top and “Low Freq” at the bottom. A smiling brain icon with radiating lines indicates cognitive understanding or analysis. - A green arrow points from the time domain to the frequency domain, illustrating the transformation process. 2. **THE BIG IDEA: SPEED-UP!** This section contrasts the computational complexity of the Discrete Fourier Transform (DFT) with the Fast Fourier Transform (FFT). - Left side: “SLOW DFT N²” is represented by three stacked books labeled “N²”, “COMPUTATION”, and “COMPUTATION”, pulled by a slow-moving green turtle. - Right side: “FAST FFT” is illustrated by a rocket ship with flames, labeled “FFT COMPUTATION N log N”, accompanied by a cheerful pink rabbit. - A red arrow points from the turtle to the rocket, emphasizing the speed improvement. - A thinking boy character with a question mark above his head connects this section to the previous one via a dashed arrow, indicating curiosity or inquiry. 3. **KEY APPLICATIONS** This section lists four major real-world applications of FFT, each with an illustrative icon: - **SIGNAL PROCESSING**: A radio tower emitting waves connected to two control panels. - **IMAGE COMPRESSION**: A document labeled “JPEG” transforming into a landscape photo. - **AUDIO ANALYSIS**: A robot with headphones next to an audio equalizer display. - **SCIENTIFIC DATA**: A graph showing an upward trend alongside a beaker with bubbling liquid and a chemical structure diagram. 4. **HOW IT WORKS (Simplified)** This section breaks down the algorithmic approach using two core concepts: - **DIVIDE & CONQUER**: Illustrated with interlocking gears labeled “DATA”, splitting into smaller gear clusters, symbolizing breaking down data into manageable parts. - **RECURSION**: Shown with a circular arrangement of gears in alternating red and blue, rotating in opposite directions, representing iterative processing. - A scientist character in a lab coat points toward these concepts, standing between them. - To the right, a simple flowchart depicts the recursive process: a pink “START” box leads to a diamond-shaped decision node (“----”), which branches to “STEP 1”, “STEP 2”, and then to “STEP 3”, with arrows looping back to STEP 1 and STEP 2, indicating iteration. A lightbulb icon above the flowchart signifies insight or innovation. The overall visual style is clean, educational, and engaging, using consistent color palettes (peach, coral, teal, red, green, blue) and whimsical characters to demystify a complex mathematical concept. All text is in English, clearly legible, and positioned for easy reading. The dashed arrows connecting the sections create a narrative path that guides the viewer through the explanation: from raw signals to spectrum, then to the speed advantage, applications, and underlying mechanics.
More Images