
About this collection
Every Fiverr gig lives or dies by a single image. Each cover here respects the real constraints of a gig image - one banner-shaped canvas, high-contrast text, and no clutter that would collapse at small sizes.
These are starting points, not finished listings. Every cover here is built around one idea: a single service promise, set in type large enough to survive being shrunk into Fiverr's search grid. The collection spans roughly thirty service areas — software and app development, design and branding, writing and translation, marketing, audio, data, and business consulting — so you can usually find a layout close to what you sell and adapt it.
Nothing here is a layered design file. Each one is a flat generated image, which is exactly what makes it quick: pick a layout, swap the headline, palette, and icons for your own service, and you have a listing image in a few minutes rather than an afternoon.
What a gig cover actually has to do
A buyer scanning search results sees your cover as a thumbnail no wider than a postage stamp, sitting next to a dozen competitors. That single constraint decides almost everything else:
- One promise, not a service list. "I will fix your WordPress site in 24 hours" reads at thumbnail size. "WordPress | SEO | Speed | Security | Maintenance" turns to mush.
- High contrast between text and background. Thin light type on a pale panel is the first thing to disappear when the image shrinks.
- Three to six words in the headline. Long headlines force small type, and small type is what becomes unreadable first.
- The service visible before reading a word. A layout cue — a device frame, a waveform, a chart, a colour swatch — tells the buyer the category instantly.
Resizing and export
Fiverr publishes its own requirements in the uploader, and they change - check them there rather than trusting a number quoted in a blog post. What does not change is the direction of the resize: always scale down from the download. Never upscale a smaller image to reach the uploader's width, because the text edges go soft, and soft type is exactly what a thumbnail cannot afford.
When you trim to match the uploader's proportions, do it symmetrically and keep the headline centred, so the crop does not eat one side of the promise.
Three things worth doing before you upload
- Judge the thumbnail, not the full-size file. Shrink the preview down to search-result size, or just squint. If the promise still reads, the cover works. 2. Keep a colour system across your gigs. Buyers skim a grid of near-identical covers; a consistent accent colour makes your listings recognisable among strangers. 3. Leave the outer margin clear. Gig images get cropped slightly differently across placements, so keep text away from the outer edge of the canvas.
Common questions
Will the downloaded cover meet Fiverr's upload requirements?
Check the uploader: Fiverr shows its current accepted format, file limit and recommended image spec there, and those are the platform's requirements, not ours. What matters on this side is direction — start from the downloaded cover and scale down to fit, never up from a smaller file.
Will the text still be readable in the search grid?
Shrink it to search-result size before uploading. That is close to what buyers actually see when comparing gigs, and it is where most covers fail — usually because the headline was set too small or the contrast was too low to begin with.
How many images should one gig have?
Fiverr's gallery takes up to three images and two videos. Lead with the strongest cover, then spend the remaining slots on a work sample, a before-and-after, or a deliverable preview rather than more headline art.
Can I use the same cover on several gigs?
No. Buyers often see two or three of your gigs together, and identical covers make them look like one listing repeated. Change the headline, the accent colour, and the main visual so each gig reads as its own service.
Can I change the text or colours after generating?
Not in place. The wording is baked into the image, so there is no text layer to retype. Download it and edit it in your own tool, or use the "Use as Template" option to regenerate it with different copy.
Why do the covers in this collection look so different from each other?
Because the range is deliberately broad. Each cover was written around the specific service it advertises, so a logo animation cover and a translation cover share a job — selling one service at thumbnail size — but not a visual style. That variety is what lets you give every gig a distinct look.
![[Format]
Landscape 16:9 gig cover, modern dark-gradient tech style with a centered headline and a photographic cutout. Smooth studio-glow finish, sharp vector pills. No watermark, no personal names.
[Layout]
A deep navy-to-black gradient fills the frame, with a large soft purple radial glow blooming from the lower-left corner and a smaller violet haze upper-right. The composition is vertically centered: a small glowing purple app icon sits at top center, the two-line headline dominates the upper-middle half in huge centered white type, and a photographic cutout of a man rises from the bottom edge at center, his head wedged into the gap between the two headline lines. Four white pill badges float in the mid-ground, two on each side of the person at staggered heights, each slightly rotated. Generous dark space surrounds everything, giving a floating, premium feel.
[Subject]
A young South Asian man in his mid-twenties with short dark hair, black rectangular glasses and a full beard, cut out and placed bottom-center, visible from mid-chest up. He wears a dark suit jacket, white shirt and navy tie, looking straight at the camera with a slight confident smile. Even, soft frontal lighting. His head slightly overlaps the bottom of the headline's second line.
[Headline]
Top center: a purple rounded-square app icon with a white document-and-pen glyph, glowing. Then the headline "Sales Funnel Copy" in a very large modern geometric sans-serif, title case, pure white, breaking as "Sales Funnel" / "Copy", both lines centered, occupying nearly the full width.
[Badges]
Four white rounded pill badges with soft shadows, each containing a small purple four-point sparkle icon and dark navy sans-serif text: "High Conversion" (left, mid-height), "Free Plagiarism Report" (left, lower), "Research Based" (right, slightly higher), "Proven Results" (right, lower).
[Mood]
Midnight navy, violet glow and crisp white — sleek, professional, tech-forward. The giant white headline and glowing purple accents keep the cover legible and striking even at very small thumbnail sizes.](https://files.posterlet.com/assets/generated/md/xtzaprzjp1cv.webp)
![[Format]
Landscape 16:9 gig cover, bold two-tone character lineup cover. Glossy 3D-render plus photo-cutout finish. No watermark, no personal names.
[Layout]
The background is a hard diagonal split: vivid yellow fills the left two-thirds and solid black the right third, the divide slanting from top-centre to bottom-right. Yellow dot-grid clusters decorate the black side's top corner and the yellow side's left edge. The headline block sits top-left on the yellow. Three 3D cartoon characters stand in a row across the middle-left of the yellow zone, cropped by the bottom edge: a businesswoman on the left, a suited businessman in the centre pointing a finger upward, and a construction worker in a hi-vis vest on the right with a hand to his chin. The right third is dominated by a large photo cut-out of a man layered over the black field, his white shirt filling the lower corner and his head reaching the top edge, partially behind the worker character.
[Subject]
Right side: a smiling young man in a white baseball cap and a white button shirt, chest-up, brightly front-lit, cut out with a thin white edge over the black panel.
[Headline]
Top-left: "2D–3D ANIMATION" in very large black extra-bold caps on the yellow; directly beneath, a white rounded-rectangle plate holding "250+ PROJECTS DELIVERED" in smaller black caps.
[Badges]
None beyond the white headline plate; the dot grids act as decoration.
[Mood]
Saturated yellow, black and white; playful, high-energy, creator-brand feel; the yellow/black split and the white cut-out pop hard at thumbnail size.](https://files.posterlet.com/assets/generated/md/zoldsnnwlup2.webp)
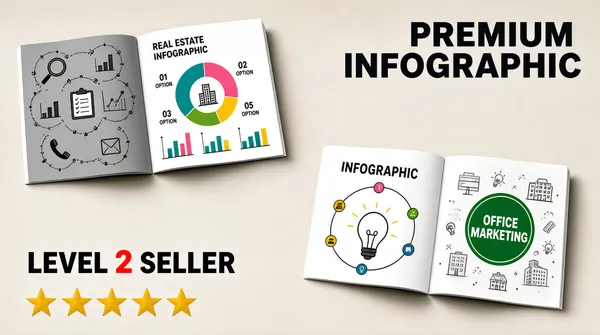
![[Format]
Landscape 16:9 gig cover, product-photography style mockup of bi-fold brochure spreads on a neutral studio backdrop. Soft realistic shadows. No watermark, no personal names.
[Layout]
A light warm-grey seamless background, empty at the edges. Four open bi-fold brochure mockups float in a staggered 2x2 arrangement with generous white space between them, each showing two pages at a slight angle with soft shadows beneath: the top-left spread has a grey left page ringed by doodle office icons (magnifier, clipboard, charts, phone, envelope) and a right page titled "REAL ESTATE INFOGRAPHIC" with a multicolour donut chart (teal, pink, green, yellow segments labelled 01 OPTION through 05 OPTION), a building icon at the donut centre and small bar charts below; the bottom-right spread has a left page titled "INFOGRAPHIC" with a big white circle holding a lightbulb and an orbit of coloured dots and tiny icons, and a right page of light-grey doodles around a green "OFFICE MARKETING" circle badge. Typography blocks sit directly on the background, not on the brochures: one in the top-right corner, one in the bottom-left corner.
[Subject]
None — printed mockups only.
[Headline]
Top-right: "PREMIUM INFOGRAPHIC" in dark-grey bold caps on two lines. Bottom-left: "LEVEL 2 SELLER" in dark-grey bold caps with the "2" in red, and a row of five golden-yellow stars beneath it.
[Badges]
The five-star rating row bottom-left; donut-segment percentage labels and small chart icons inside the brochures.
[Mood]
Warm grey and white with teal, pink, green and yellow chart accents; calm portfolio-on-a-table feel; the spreads and the star row still read at thumbnail size.](https://files.posterlet.com/assets/generated/md/12xug8frpr3j.webp)
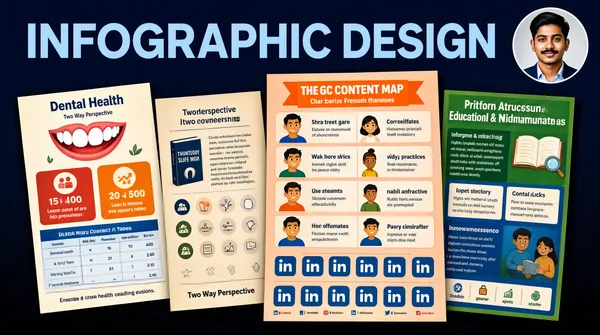
![[Format]
Landscape 16:9 gig cover, showcase collage of tall infographic posters under a full-width headline. Detailed print-mockup finish. No watermark, no personal names.
[Layout]
A deep navy gradient background, lighter at the top and darkening toward the bottom. The top quarter is one huge pale-blue headline spanning edge to edge. Below it, five vertical infographic posters overlap in a loose fanned collage filling the lower three-quarters: far left a cream dental-health poster with cartoon teeth, red and orange stat boxes and a blue table; next a two-column beige poster with a small book-cover graphic at its top, rows of round icons and a "Two Way Perspective" footer; centre-right the tallest poster, a peach-toned content map with an orange banner header, illustrated character rows and repeated social-channel strips; far right a green-and-blue educational poster with dense paragraph blocks and small illustrations. The posters tilt slightly and cast soft shadows onto the navy. A circular portrait photo with a thin light rim sits in the top-right corner.
[Subject]
Top-right circle: a young South Asian man with short dark hair and a neat moustache, navy suit jacket over a light shirt, friendly neutral expression, head-and-shoulders, evenly lit, cut into a perfect circle.
[Headline]
"INFOGRAPHIC DESIGN" across the top in very large light-blue caps with wide tracking, one line.
[Badges]
Inside the posters: repeated LinkedIn logos — small blue rounded squares with a white "in" — in the tall centre poster's channel strips; generic colourful icon chips elsewhere.
[Mood]
Navy blue, cream, peach and green; dense, busy, portfolio-spread energy; the giant pale headline over dark navy anchors the cover at thumbnail size.](https://files.posterlet.com/assets/generated/md/0eiwk1qfoeco.webp)
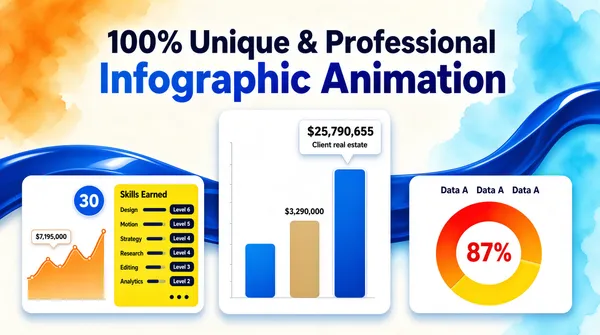
![[Format]
Landscape 16:9 gig cover, bright SaaS-style composition with soft gradient blobs and floating dashboard cards. Smooth modern vector finish. No watermark, no personal names.
[Layout]
The background is an off-white canvas washed with soft watercolour blobs — warm orange in the top-left corner, cool cyan-blue on the right — plus a thick glossy blue ribbon wave flowing from the left edge across the middle and curling up the right side. The headline occupies the top quarter. The bottom two-thirds carry three white rounded-corner dashboard cards floating in a row with soft drop shadows: the left card holds an orange line/area chart with a small blue "30" badge and, beside it, a bright yellow panel listing skill rows with navy progress bars; the tall centre card, raised higher than its neighbours, holds a three-bar column chart in blues and tan with a floating white tooltip card over the tallest bar; the right card holds a donut gauge. The cards slightly overlap the blue ribbon behind them.
[Subject]
None — dashboard mockups only.
[Headline]
Top centre-left, two lines: "100% Unique & Professional" in dark navy semi-bold, then "Infographic Animation" larger in a blue-to-indigo gradient bold sans beneath it.
[Badges]
Chart micro-labels inside the cards: dollar callouts "$7,195,000", "$25,790,655" and "$3,290,000"; the tooltip card carries a small grey client-real-estate line of text; the yellow panel is headed "Skills Earned" with a three-dot menu and six short lorem-style skill rows each ending in a level chip; the right card is labelled "Data A Data A Data A" above a red-orange-yellow donut with "87%" in red at its centre.
[Mood]
White, sky blue, indigo, orange and yellow; friendly, energetic, product-demo feel; the colourful cards on white keep it crisp at thumbnail size.](https://files.posterlet.com/assets/generated/md/yw5otimjkwfa.webp)
![[Format]
Landscape 16:9 gig cover, ultra-minimal flat typographic poster. Clean matte vector finish. No watermark, no personal names.
[Layout]
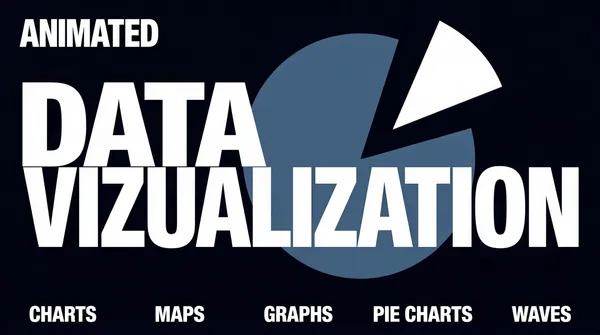
A single flat panel in very dark navy, almost black, with generous empty space. A huge pie-chart shape dominates the centre-right: a large circle in slate blue occupying about 55% of the frame height, centred slightly right of middle, with one white wedge slice pulled out and offset toward the top-right, the gap exposing the dark background. The typography sits on top of and beside this shape. A single row of five small labels runs along the bottom edge, evenly spaced across the full width. Everything else is negative space; no borders, no panels, no depth cues — pure flat 2D.
[Subject]
None — typographic only.
[Headline]
Top-left, "ANIMATED" in white bold caps at medium size. Centre, two stacked lines in huge white condensed extra-bold caps that overlap the pie shape: "DATA" on the first line starting left of the circle, "VIZUALIZATION" beneath it spanning nearly the full frame width. Bottom row, small white bold caps labels evenly spaced left to right: "CHARTS", "MAPS", "GRAPHS", "PIE CHARTS", "WAVES".
[Badges]
None.
[Mood]
Near-black navy, slate blue and white only; quiet, editorial, confident; the giant pie silhouette and the heavy white type keep it legible at thumbnail size.](https://files.posterlet.com/assets/generated/md/1vawhgxoy9e7.webp)
![[Format]
Landscape 16:9 gig cover, bold advertising composition pairing oversized typography with three bordered infographic panels. Crisp vector finish. No watermark, no personal names.
[Layout]
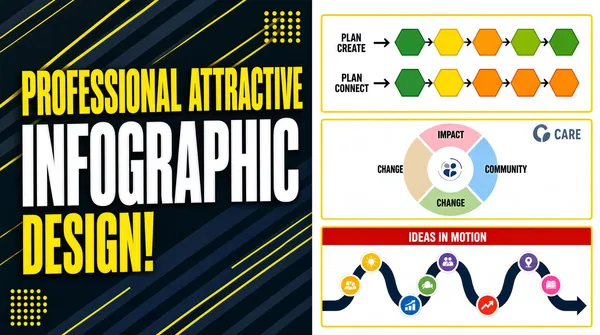
The frame splits roughly in half. The left half is the headline zone on a dark charcoal-navy background built from wide diagonal stripes running top-left to bottom-right, with thin yellow diagonal accent lines crossing them and small yellow dot-grid clusters tucked into the top-right and bottom-left corners. The right half is a vertical stack of three wide rectangular infographic cards, each with a thin yellow border and a white interior, separated by small gutters and running nearly full height: the top card shows a horizontal workflow chart with two rows of small labelled text columns connected by arrows and a middle band of colourful hexagon step icons in greens, yellows and oranges; the middle card shows a circular cycle diagram of pastel sectors (pink, blue, green, beige) around a small centre hub, with a tiny charity-style organisation logo in its top-right corner; the bottom card shows a snaking wave path with coloured circular icons threaded along it like beads, under a red header bar.
[Subject]
None — typographic plus document panels only.
[Headline]
Left zone, three stacked lines, all condensed extra-bold caps, left-aligned with a slight stepped indent: "PROFESSIONAL ATTRACTIVE" in yellow, then "INFOGRAPHIC" in white at nearly twice the size spanning the full left half, then "DESIGN!" in yellow again below it.
[Badges]
A faint small logo-and-text lockup in the middle panel's top-right corner (generic organisation mark). Yellow dot-grid clusters act as decorative badges in the corners.
[Mood]
Charcoal black, navy and vivid yellow with white type; high contrast, confident, poster-like; the yellow-bordered panels glow against the dark stripes so the cover reads clearly even at thumbnail size.](https://files.posterlet.com/assets/generated/md/ou4atdv1vee7.webp)
![[Format]
Landscape 16:9 gig cover, clean flat-vector corporate infographic layout on a white page with black header and footer bands. Crisp geometry, flat fills, thin grey keylines, soft grey shadows. No watermark, no personal names.
[Layout]
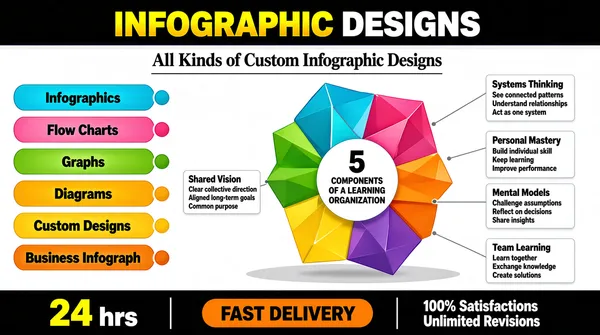
The frame is banded top and bottom. A solid black band runs across the top eighth and holds the headline; a matching black band runs across the bottom eighth with the delivery and guarantee copy. The white middle is split: the left ~40% is a vertical stack of six equal coloured rounded bars, each the same height, evenly spaced down the frame with a small disc at the right end of every bar; the right ~60% is dominated by one large faceted rosette diagram centred in the area. Thin grey leader lines radiate outward from the rosette's vertices to five small label cards placed around it — one at the mid-left, one at the upper-right, one at the lower-right and two more up the right side — each card holding a short bold head and three or four lines of grey placeholder copy. A soft grey elliptical shadow sits beneath the rosette to lift it off the page, and a hairline rule underlines the sub-headline.
[Subject]
None — no people; the hero object is the faceted rosette diagram.
[Headline]
Top black band, heavy all-caps: INFOGRAPHIC in a yellow-to-white gradient beside DESIGNS in plain white, centred and spanning about half the frame width. Below the band, a centred dark serif mixed-case sub-head "All Kinds of Custom Infographic Designs" with a hairline rule beneath. Left stack, dark bold mixed-case titles on coloured bars: Infographics, Flow Charts, Graphs, Diagrams, Custom Designs and Business Infograph. Centre of the rosette, white bold 5 over two lines of small black caps reading COMPONENTS OF A LEARNING ORGANIZATION. Bottom black band, big yellow 24 beside white hrs, then an orange pill with heavy dark italic FAST DELIVERY, and at the right a white bold two-line 100% Satisfactions and Unlimited Revisions pair split by a short vertical white bar.
[Badges]
None.
[Mood]
White, black and neutral grey with a rainbow of saturated segments — cyan, pink, green, amber and purple — plus orange and yellow accents in the bands. Bold, listy and catalogue-like; at thumbnail size the coloured bar stack and the multi-colour rosette give two strong colour anchors on white.](https://files.posterlet.com/assets/generated/md/pzbe27lk7gj2.webp)
![[Format]
Landscape 16:9 gig cover, dark corporate vector layout with a fanned paper-sample collage. Crisp edges, diagonal light streaks, saturated flats, soft paper shadows. No watermark, no personal names.
[Layout]
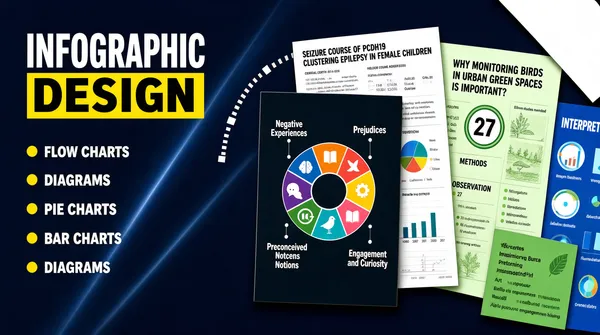
A deep navy background carries two faint diagonal light streaks that rake across the frame. The left ~40% is a typographic column: a two-line headline stacked in the upper-left third, then a vertical list of five uppercase items running down the lower-left, each with a small round bullet. The right ~60% is a layered collage of infographic sample pages that fan and overlap like scattered print, scaled small so only their headers and inner charts are readable. A tall dark card sits front-centre-left of the collage with a circular eight-segment wheel of coloured icon wedges at its middle and small text blocks arranged around it; behind and above it, a white report card and a green field-study card tilt at slight angles; a blue side panel peeks out at the far right edge. One small green card overlaps the blue panel at the lower-right, and a thin white card slides in at the top-right. A dotted arc and pale tick marks float near the centre to bridge the text column and the collage.
[Subject]
None — no people; the subjects are the fanned infographic sample sheets and the segmented process wheel.
[Headline]
Upper-left, a two-line stack in heavy all-caps sans: INFOGRAPHIC in white, then DESIGN in black sitting on a bold yellow highlight slab, together roughly a third of the frame height. Below, five white bold all-caps list items each led by a small yellow disc: FLOW CHARTS, DIAGRAMS, PIE CHARTS, BAR CHARTS, DIAGRAMS. Inside the collage, small sample titles appear as tiny dark sans heads, including a white card reading SEIZURE COURSE OF PCDH19 CLUSTERING EPILEPSY IN FEMALE CHILDREN, a green card reading WHY MONITORING BIRDS IN URBAN GREEN SPACES IS IMPORTANT? with methods sub-heads and a circular 27, and a blue right-hand panel headed INTERPRET. The dark front card shows two columns of small headings in the Negative Experiences and Prejudices, Preconceived Notions and Engagement and Curiosity register arranged around the wheel.
[Badges]
None.
[Mood]
Deep navy with hot yellow, cyan, green and coral accents drawn from the sample pages. Authoritative and portfolio-like; at thumbnail size the yellow slab behind DESIGN and the fanned pastel cards pop hard against the dark ground.](https://files.posterlet.com/assets/generated/md/342r4tbaueed.webp)
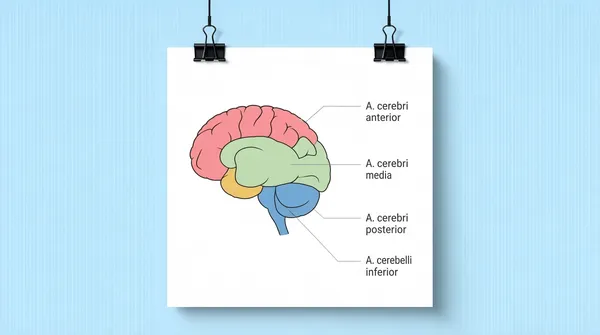
![[Format]
Landscape 16:9 gig cover, minimal studio product-mockup with a clean flat-vector medical illustration on paper. Soft even studio light, gentle drop shadow, no texture noise. No watermark, no personal names.
[Layout]
A flat pale sky-blue field fills the whole frame with an even, near-monochrome wash and no horizon. Dead centre sits a single portrait-orientation white poster, roughly two thirds of the frame height, held by two black butterfly binder clips that clamp its top edge; thin clip cords run vertically up out of the frame from each clip. The sheet casts a soft grey shadow down and slightly right, lifting it off the blue ground. Inside the poster, a single anatomical illustration occupies the middle-right of the page with generous white margins, and four thin grey leader lines run from its right edge out to four short two-line labels aligned along the right side of the sheet. The composition is otherwise empty, giving the poster enormous breathing room.
[Subject]
A flat-vector anatomical cross-section drawing of a human brain, seen in profile and built from smooth overlapping lobes: a pink-red upper-front lobe, a large pale-green mid lobe, a small ochre-yellow node on the lower left, and blue lobes wrapping the base and lower rear. Flat fills with thin darker outline strokes and no realistic shading — a diagram, not a photograph. No people.
[Headline]
No headline. Only four tiny grey sans labels in two-line stacks along the right side of the poster, reading short anatomical captions of the "A. cerebri anterior" type, each connected by a hairline rule to a point on the illustration.
[Badges]
None.
[Mood]
A single calm sky-blue ground with the white sheet and soft pastel pink, green, yellow and blue lobes as the only colour. Quiet, clinical and gallery-clean; at thumbnail size it is one crisp white rectangle with a small pastel diagram floating in a big blue field.](https://files.posterlet.com/assets/generated/md/3htexqq4i2sy.webp)
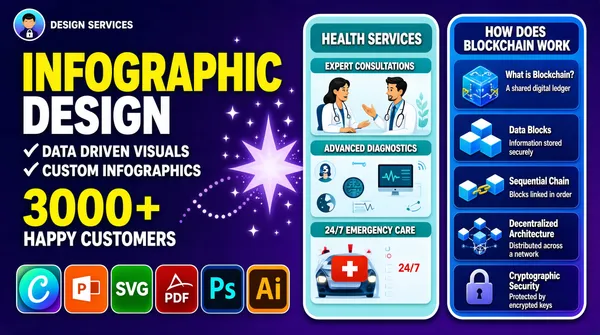
![[Format]
Landscape 16:9 gig cover, bold dark vector promo layout with two flat infographic phone panels. Crisp edges, saturated flats, subtle lavender sparkle. No watermark, no personal names.
[Layout]
A deep violet gradient fills the frame. The left ~45% is a text column: a small brand lockup at the very top-left, then the stacked headline occupying the upper-left half, then a two-line benefit list, a large stat line, and a bottom row of six app tiles running along the lower-left. The right ~55% holds two tall vertical rounded-rectangle panels that read as phone screens, side by side with a narrow gutter, standing plumb, each crowded with stacked mini-sections and small illustrations. The left panel is light blue and teal, the right panel is azure and indigo, and both run from near the top to the bottom of the frame. A pale starburst and a dotted arc float in the gap between the text column and the panels.
[Subject]
None — no people; the subjects are the two illustrated infographic panels and the app-tile row.
[Headline]
Top-left, a two-line stack in heavy all-caps sans: INFOGRAPHIC in bright yellow, then DESIGN in white, together about a third of the frame height. Below, two check-marked lines in white bold all-caps: DATA DRIVEN VISUALS and CUSTOM INFOGRAPHICS. Then a stat line, 3000+ in oversized yellow beside HAPPY CUSTOMERS in white. Left panel headings inside a light blue card: HEALTH SERVICES in white on teal with sub-blocks EXPERT CONSULTATIONS, ADVANCED DIAGNOSTICS and 24/7 EMERGENCY CARE, each with a small illustration of a doctor, patient or globe. Right panel headings on blue: HOW DOES BLOCKCHAIN WORK with stacked white sub-heads What is Blockchain?, Data Blocks, Sequential Chain, Decentralized Architecture and Cryptographic Security, each with a short grey caption and a blue-and-yellow illustration of a person or device.
[Badges]
Bottom-left row of six rounded-square app tiles: the Canva mark, a teal-to-blue gradient disc with a white curly C; the PowerPoint mark, an orange rounded square with a white P; a green tile with a white SVG badge; the Adobe Acrobat PDF mark, a red tile with a white glyph; the Photoshop mark, a dark blue tile with a cyan Ps; and the Illustrator mark, an orange tile with an amber Ai. Top-left corner of the frame: a small circular avatar tile beside a short uppercase two-word lockup for a design services brand.
[Mood]
Deep violet ground with hot yellow, cyan, teal and orange accents for a confident tech feel. Busy but organised; at thumbnail size the big yellow-and-white headline and the two tall glowing panels read instantly.](https://files.posterlet.com/assets/generated/md/ntsl0qmzxxt7.webp)
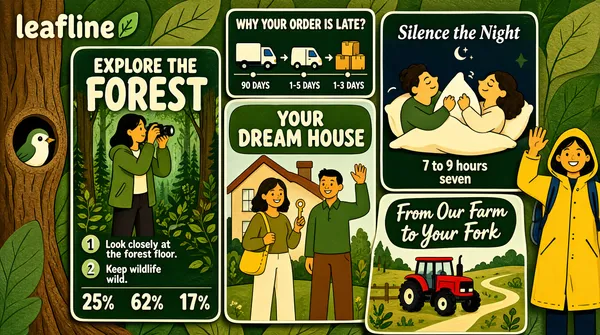
![[Format]
Landscape 16:9 gig cover, hand-drawn flat-illustration infographic board in muted earthy tones. Textured paper grain, soft flat fills, rounded organic shapes, no gradients. No watermark, no personal names.
[Layout]
A dense pinboard of six illustrated poster tiles overlaps across an olive-green botanical backdrop, with large stylised leaves and a brown tree trunk intruding from the left edge (a small bird peeks from a hole in it) and a standing figure at the far right. Top-left hotspot: a lowercase rounded-sans wordmark for an illustration studio with a small leaf accent, floating over the background. The tiles read left to right: a tall centre-left panel headlined EXPLORE THE FOREST showing a woman with a camera, numbered circular call-outs 1 and 2 with body copy, and a bottom stat row of 25%, 62% and 17%; a narrow top-centre strip titled WHY YOUR ORDER IS LATE? with a ship, a delivery van and boxes plus the figures 90 DAYS, 1-5 DAYS and 1-3 DAYS; a centre-bottom tile titled YOUR DREAM HOUSE with a couple holding a key beside a house; a tall top-right tile titled Silence the Night with two people asleep on a pillow and small sleep-stat notes such as "7 to 9 hours" and "seven"; and a lower-right tile titled From Our Farm to Your Fork showing a red tractor and a food-journey path. The tiles overlap slightly with thin white keylines and drop shadows, sized unevenly so the board feels hand-assembled.
[Subject]
Flat illustrated characters, not photographed: a woman in a green hooded jacket holding a camera in the forest tile, a woman with a yellow bag and a man waving in the house tile, two figures pillow-fighting in the night tile, and at the far right edge a standing woman in a yellow-and-olive raincoat with a backpack, cropped at the knees, waving toward the viewer. All are drawn in flat vector with simple faces and no shading.
[Headline]
Tile titles in chunky mixed-case illustrated sans: EXPLORE THE FOREST in cream on deep green with FOREST oversized, WHY YOUR ORDER IS LATE? in cream on dark green, YOUR DREAM HOUSE in cream over a green plate, Silence the Night in white italic serif over dark green, and From Our Farm to Your Fork in cream script on a dark green badge. Small navy body paragraphs and big cream numerals 25%, 62% and 17% fill the forest tile; tiny cream labels mark the delivery milestones.
[Badges]
None.
[Mood]
Olive, forest green, warm cream and soft yellow with earthy brown bark accents and a single hot-red tractor. Crafted, editorial and outdoorsy; at thumbnail size the overlapping green tiles against the botanical backdrop read as a busy, warm infographic collage.](https://files.posterlet.com/assets/generated/md/2v1mijqqk2qd.webp)
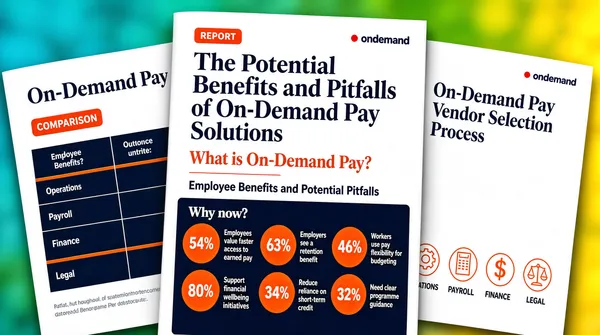
![[Format]
Landscape 16:9 gig cover, realistic print-mockup presentation of stacked report pages. Soft photo-real paper shadows, blurred gradient backdrop, fine serif and sans print typography. No watermark, no personal names.
[Layout]
Three white document pages are fanned across the frame against a heavily blurred cyan-to-green-to-yellow gradient, as if photographed at a slight angle. The left page sits lowest and furthest left, cropped by the frame edge, tilted a few degrees counter-clockwise. The centre page lies on top and forward, upright and nearly full height, its bottom cropped; it is the most legible of the trio and carries the main headline block, an illustration band and a dark stat panel. The right page is partly hidden behind the centre sheet, tilted clockwise, showing its top-right corner and a lower icon row. Cast shadows fall to the right of each sheet, giving a shallow paper depth stack.
[Subject]
None — no people; the subject is the overlapping trio of infographic report pages.
[Headline]
Centre page, large dark-navy serif headline "The Potential Benefits and Pitfalls of On-Demand Pay Solutions" over three lines, with a small orange-red eyebrow chip above it. Below, an orange heading "What is On-Demand Pay?" and a section head "Employee Benefits and Potential Pitfalls". A dark panel titled "Why now?" holds six orange circular stat bubbles reading 54%, 63%, 46%, 80%, 34% and 32%, each with two lines of tiny caption. Left page: a serif headline beginning "On-Demand Pay" over a dark navy comparison table with orange row rules. Right page: "On-Demand Pay Vendor Selection Process" in navy serif above a row of four orange outline icons labelled OPERATIONS, PAYROLL, FINANCE and LEGAL.
[Badges]
Top-right of the centre page: a small lowercase wordmark for an on-demand pay platform, preceded by a small red dot, set in a light rounded sans — the same small lockup repeats at the top-right of each page. Small orange call-out chips and tiny grey footnote lines sit inside the tables.
[Mood]
Clean white paper against a soft blue, green and yellow bokeh wash, punctuated by orange-red accents and navy type. Corporate, trustworthy and report-like; at thumbnail size the fanned white pages with their orange stat bubbles read clearly against the colourful blur.](https://files.posterlet.com/assets/generated/md/at9nphogzpz1.webp)
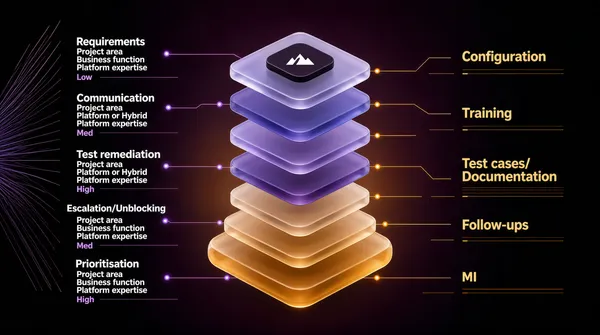
![[Format]
Landscape 16:9 gig cover, minimal dark 3D product-render aesthetic with thin technical annotation. Deep gradient background, translucent glass layers, soft bloom, fine hairline rules. No watermark, no personal names.
[Layout]
A near-black plum-purple gradient fills the frame, darkening toward the corners and lifting to a warm glow at the centre. The middle vertical third is occupied by a stacked isometric cake of eight translucent rounded-diamond layers, floating in even increments with a gap between each; the top four slabs are violet and blue-purple, the lower four shift into tan and warm amber, and the whole stack glows softly, widest at the base. The topmost slab carries a small dark rounded tile holding a white three-peak mountain mark. Flanking the stack, a left column of five and a right column of five small annotation blocks are stacked down the frame, their thin leader lines reaching inward and ending in tiny glowing dots beside the stack — purple dots on the left, amber dots on the right. Perspective hairlines fan out at the far left edge to suggest depth.
[Subject]
None — the layered isometric stack is the hero object; no people appear.
[Headline]
No display headline. Only small annotation copy: each left block reads a white semi-bold "Task" heading (Requirements, Communication, Test remediation, Escalation/Unblocking, Prioritisation) above violet micro-labels "Project area" with values Business function, Platform or Hybrid, and "Platform expertise" with Low, Med or High. The right blocks mirror the structure in amber with Configuration, Training, Test cases/Documentation, Follow-ups and MI. All type is tiny, roughly one fortieth of the frame height.
[Badges]
None.
[Mood]
Midnight plum, violet and warm tan with a soft central bloom and hairline leader lines. Calm, engineering and premium; at thumbnail size the glowing stack reads as a single bright isometric beacon framed by two columns of faint text.](https://files.posterlet.com/assets/generated/md/25p61gtyrxge.webp)
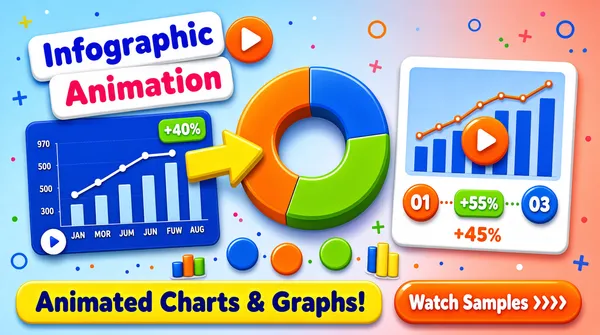
![[Format]
Landscape 16:9 gig cover, glossy flat-vector cartoon infographic style with soft 3D shading on the discs and arrows. Rounded corners, bouncy confetti, smooth pastel gradients. No watermark, no personal names.
[Layout]
The composition is a playful pinboard of three overlapping rounded cards on a light blue-to-coral gradient, peppered with tiny dots, rings and plus signs. Top-left: two tilted white title plates overlap like stacked labels, with an orange circular play button resting to the right of the upper plate. Left-centre: a royal-blue rounded chart card holding a combined vertical bar and line chart with y-axis numbers 100 to 970 and month ticks JAN MOR JUM JUN FUW AUG, a small white play disc at its lower-left and a green rounded +40% tag near its top-right. Centre: a big 3D donut pie in orange, blue and green, with a fat yellow 3D arrow driving into it from the left. Right: a wide tablet-shaped white card displaying a blue panel chart of bars and an orange line, a rounded orange play button centred on it, and beneath it a row of stat chips — an orange disc reading 01, a green +55% tag and a blue disc reading 03 linked by a dotted line, plus +45% in orange. Along the bottom, a long yellow banner sits to the left and an orange pill button to the right. Small circular swatches and mini bar clusters drift through the lower-centre to bind the cards together.
[Subject]
None — no people; the visual subjects are the rounded chart cards, the 3D donut pie and the yellow arrow.
[Headline]
Title plates upper-left in heavy rounded sans: Infographic in blue on a white plate tilted a few degrees, with Animation in red-pink below it on a second white plate. Bottom-left on a yellow slab, bold dark-blue mixed case "Animated Charts & Graphs!". Bottom-right, on an orange pill, white bold "Watch Samples" followed by four small white chevrons. Tiny grey axis numbers and the JAN-to-AUG month row label the blue chart card.
[Badges]
None.
[Mood]
Cheerful blue, coral, orange and lime on a pale sky gradient, glossy and candy-bright. Fast, friendly and animated-feeling; at thumbnail size the blue chart card, the 3D donut and the yellow and orange buttons read as three clear focal beats.](https://files.posterlet.com/assets/generated/md/7u6yjtl5sbdj.webp)
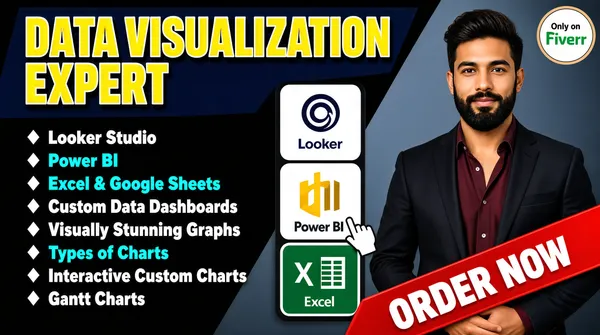
![[Format]
Landscape 16:9 gig cover, hard-edged graphics-plus-photo promo card. Flat vector panels, saturated fills, crisp cut-out photography, slight vignette. No watermark, no personal names.
[Layout]
A dark charcoal background is cut by a large soft-edged diagonal wedge of lighter slate running from the upper-right down to the mid-left, so the frame reads as two overlapping planes. The upper-left is taken by a dark navy right-angled plate that carries the two big headline lines. Directly beneath it, in the left-centre, a single left-aligned list runs down the frame as six text lines, each prefixed by a small diamond glyph. A narrow vertical brand rail sits just right of centre, stacked top to bottom, holding three app tiles with wordmarks; a small white pointing-hand cursor overlaps the lower two tiles with its fingertip aimed at the red bar below. The right ~40% is filled edge-to-edge by a photographic cut-out of the seller standing behind a red ribbon that crosses the bottom-right corner. A small circular badge floats in the extreme top-right.
[Subject]
A bearded man in his early thirties, dark hair swept up, wearing a dark suit jacket over a dark maroon open-collar shirt, arms relaxed with hands clasped at his waist, framed waist-up and lit by a plain studio key from the front-left; he occupies the right 40% of the frame, shoulders cropped by the right edge, and the red bar passes in front of his lower torso.
[Headline]
Upper-left, on the navy plate: DATA VISUALIZATION stacked above EXPERT, both in heavy all-caps sans filled yellow with a white outline and a soft dark shadow, the top line spanning about half the frame width. The list below alternates white and bright cyan bold all-caps sans: Looker Studio, Power BI, Excel & Google Sheets, then Custom Data Dashboards, Visually Stunning Graphs, Types of Charts, Interactive Custom Charts, Gantt Charts. Bottom-right, on a red ribbon tilted slightly, heavy white all-caps ORDER NOW at roughly one fifth of the frame width.
[Badges]
Centre rail, top to bottom: a white tile with the Looker mark — a circular red-green-blue ring glyph over a blue swirl — and the small Looker wordmark beneath it; a white tile with the Power BI yellow-and-amber three-bar column glyph and the Power BI wordmark under it; a green rounded square with a white X over a spreadsheet grid, the Excel mark. Extreme top-right: a white disc with a thin tan ring reading "Only on" in small text above a bold green Fiverr wordmark.
[Mood]
Charcoal and navy with hot yellow, cyan, red and green accents and one photographic face for warmth. Direct-sales, loud and high-contrast; even shrunk to a thumbnail the yellow headline, the app-tile rail and the red ORDER NOW bar stay legible.](https://files.posterlet.com/assets/generated/md/1y28gb8xe277.webp)
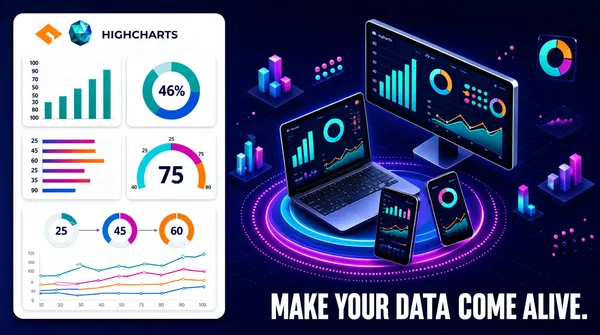
![[Format]
Landscape 16:9 gig cover, flat vector design blended with soft 3D isometric illustration. Crisp vector edges, smooth gradient glows, glossy highlights, high contrast on a dark base. No watermark, no personal names.
[Layout]
The frame splits into two unequal zones over a deep indigo-to-midnight-blue gradient carrying a faint dotted perspective grid. The left ~42% is a tall white rounded-rectangle panel, radius about 24px, inset from the edges, and inside it sits a 2-column grid of six small white chart cards with soft drop shadows and roughly 16px gutters, plus one full-width card along the panel bottom. Reading the six cards row by row: vertical teal bar chart with axis labels 10 to 100; donut chart with a large 46% centre label; horizontal orange-and-pink bar chart; concentric multi-ring arc gauge with 75 in the middle; two-series area chart in cyan and orange; and a small dot-matrix grid chart. The full-width bottom card holds three donut gauges labelled 25, 45 and 60 joined by arrows, sitting above a multi-series line chart in cyan, red and orange. The right ~58% is open dark space filled by an isometric 3D scene: a laptop at centre-left, a wide monitor behind and to its right, and two phones angled in front, each screen showing a miniature dashboard of bars, rings and line charts. Glowing magenta-purple concentric platforms and dotted ring halos sit under the devices to give depth, while faint isometric bar clusters, tiny pink dots and floating mini-charts scatter near the corners. A white headline is anchored across the bottom-right.
[Subject]
None — typographic and illustration only; the nearest thing to characters are the isometric devices and their floating chart fragments.
[Headline]
A single line of white extra-bold condensed sans, all caps, "MAKE YOUR DATA COME ALIVE." set flush-right along the bottom-right corner at roughly one twelfth of the frame height, with a period closing the line. Small unlabelled axis numbers and percentage figures sit inside the chart cards.
[Badges]
Top-left inside the white panel carries the Highcharts lockup: an orange angular three-lobe mark immediately left of a faceted teal-and-blue diamond gem icon, followed by a white uppercase HIGHCHARTS wordmark with wide letter-spacing, about one fourteenth of the frame width.
[Mood]
A deep midnight blue and indigo palette cut by electric cyan, magenta and orange accents and a bright white panel that reads as the light source. Energetic, technical and premium; at thumbnail size the white chart panel and the glowing isometric cluster pop instantly against the dark field.](https://files.posterlet.com/assets/generated/md/7tbutqe2a3m5.webp)
![[Format]
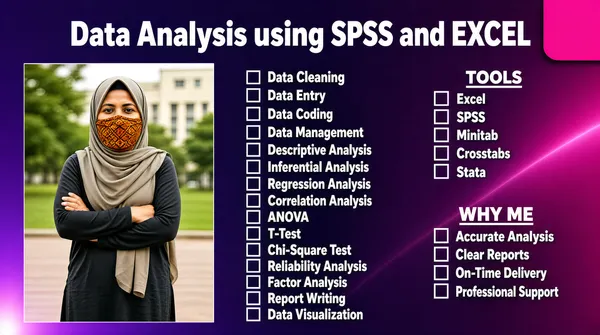
Landscape 16:9 gig cover, dark violet slide with three text columns and one portrait photograph. Smooth gradient finish, no panels or plates. No watermark, no personal names.
[Layout]
A deep violet-to-magenta gradient fills the frame with a soft glow at the lower left and a faint diagonal light band across the right side. A single solid magenta rounded rectangle sits flush in the top-right corner like a tab, about one-eighth of the frame width. A centred white headline runs across the top band just left of that tab. Below it the body splits into three columns with even gutters: a portrait photograph on the left about a quarter of the width, reaching from just under the headline down near the bottom edge; a long single checklist of about fifteen lines down the centre taking roughly 40 percent of the width; and a right column split into two stacked checkbox groups separated by a gap. Everything is white type sitting directly on the gradient.
[Subject]
A woman standing outdoors, photographed and cropped around mid-thigh, wearing a khaki-grey hijab draped over the chest and a dark long-sleeved tunic, with a patterned orange fabric face covering, arms folded, facing the camera. Soft overcast daylight, blurred green park foliage and a pale building behind her. She fills the left portrait rectangle edge to edge, occupying the left quarter of the frame beneath the headline.
[Headline]
Top centre, one line of heavy white sans in title case reading Data Analysis using SPSS and EXCEL, about one-tenth of frame height, with both tool names in the same white weight. The right column carries two bold white underlined headings in spaced caps, about half the headline size, the first reading TOOLS and the second reading WHY ME. The centre column is about fifteen small white sans lines in title case, each led by a tiny white outlined square tick. The right groups hold five and four lines respectively, using the same small white outlined squares as ticks.
[Badges]
None — the Tools column types the tool names Excel, SPSS, Minitab, Crosstabs and Stata as a plain checkboxed list, and the Why Me column lists four short service promises the same way.
[Mood]
Deep violet, magenta and white with a warm khaki portrait tone; polished, calm and orderly. At thumbnail size the white headline over violet and the magenta corner tab are the strongest cues.](https://files.posterlet.com/assets/generated/md/j6zou0jp3ej2.webp)
![[Format]
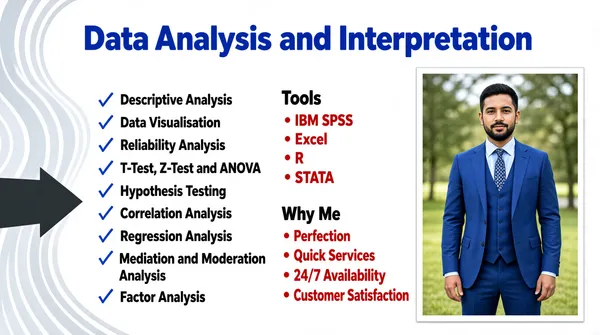
Landscape 16:9 gig cover, light corporate slide with a framed portrait. Flat printed look, soft grey line-work. No watermark, no personal names.
[Layout]
A pale sky-white background with a soft grey ribbon of curving lines sweeping up the left edge, and a dark charcoal arrow-shaped band on the mid-left edge pointing right into the content with its tail running off frame. A centred blue headline runs across the top band. The body divides into three zones: a left column of nine checkmarked service lines, a narrower middle column split into two stacked groups under separate headings, and a right column holding a tall rectangular portrait photograph inset from the frame edge with a clean white border. The left checklist is the tallest element and reaches down near the bottom edge; the middle column is narrower and ends higher; the portrait takes about a quarter of the width on the right, vertically centred.
[Subject]
A man in his early thirties with short dark hair and a trimmed beard, wearing a royal blue three-piece suit over a light shirt and patterned tie, standing upright facing the camera with hands relaxed at his sides, cropped around mid-thigh. Daylit outdoor setting behind him, softly blurred trees and grass, natural light. He is centred inside his portrait rectangle, which occupies the right quarter of the frame.
[Headline]
Top centre, a bold rounded blue sans headline in title case reading Data Analysis and Interpretation, about one-eighth of frame height. Left column: nine lines of medium blue sans in title case, each led by a thin blue tick, listing descriptive analysis, data visualisation, reliability analysis, t-test z-test and ANOVA, hypothesis testing, correlation analysis, regression analysis, mediation and moderation analysis, and factor analysis, with one entry running onto two lines. Middle column carries two bold black sans headings, the first reading Tools and the second reading Why Me, each followed by four bulleted lines in bold red sans, the first group naming the tool set and the second listing short service promises such as perfection, quick services, 24/7 availability and customer satisfaction.
[Badges]
None — the middle column types the tool names IBM SPSS, Excel, R and STATA in bold red as a plain bulleted list under the Tools heading.
[Mood]
Pale blue-white, royal blue and red text accents on a light ground; orderly, academic and trustworthy. At thumbnail size the blue headline and the framed suited portrait carry the layout.](https://files.posterlet.com/assets/generated/md/vz0l01x7y8zv.webp)
![[Format]
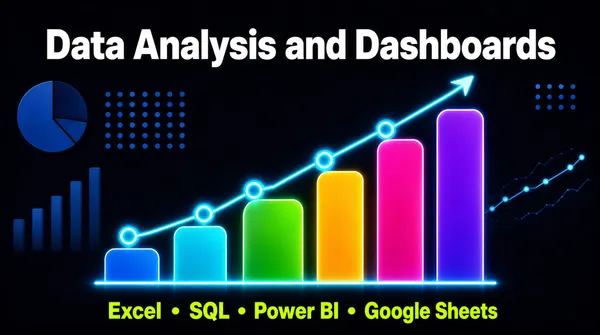
Landscape 16:9 gig cover, dark luminous data-visualisation poster. Glossy neon chart over a deep matte field. No watermark, no personal names.
[Layout]
A near-black navy field fills the frame, with faint dim dashboard hardware ghosted into it: a pie-chart silhouette at the far left, a small grid of blue dots mid-left, a cluster of dim bar columns at the lower left, a faint line-and-dot trend series at the right, and a sparse dot matrix in the upper right. The headline occupies the top quarter, centred, spanning nearly the full width. The lower two-thirds is dominated by one wide bar chart: seven vertical bars with softly rounded tops rising left to right in a rainbow progression from blue through cyan, green, amber, magenta and violet, standing on a glowing horizontal baseline that runs almost edge to edge. A bright cyan polyline with glowing circular nodes climbs diagonally across the bars from lower-left to upper-right, ending in a solid arrowhead that breaks above the tallest bar. A single centred footer line sits at the very bottom of the frame.
[Subject]
None — typographic and chart only, no people and no cut-out.
[Headline]
Top band, one line of extra-heavy white sans in title case reading Data Analysis and Dashboards, about one-fifth of frame height, tight tracking, centred, with an ampersand between the two phrases. At the bottom centre, one line of heavy bright-green sans in title case listing the tools Excel, SQL, Power BI and Google Sheets as a bullet-separated row, about one-fifteenth of frame height, each name parted by a small round green dot.
[Badges]
The footer names the tool brands Excel, SQL, Power BI and Google Sheets in plain bright-green type; the glowing line chart with its arrowhead, the ghosted pie silhouette and the dim bar columns are the only other graphic elements.
[Mood]
Midnight navy, electric cyan and a saturated rainbow bar progression with a lime footer; high-energy, techy and dashboard-forward. At thumbnail size the neon rising arrow and the rainbow bars read before any of the text.](https://files.posterlet.com/assets/generated/md/mla945l8y2b5.webp)
![[Format]
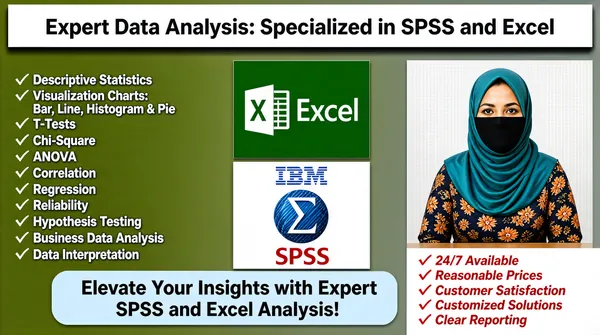
Landscape 16:9 gig cover, utilitarian presentation-slide composite with a photo panel. Flat slide finish. No watermark, no personal names.
[Layout]
A landscape slide with a top banner over a three-column body. The banner is a white plate inset from the frame edges, about one-eighth of frame height, with a thin dark drop shadow beneath it. The body splits into roughly 44 percent left text, 22 percent centre brand and 32 percent right. The centre column stacks two square brand tiles one above the other with even margins, each spanning the column width. The right column holds a rectangular portrait panel with a pale blue upper band, filling the column top two-thirds and butting the right frame edge; five short text lines stack beneath it. A pale blue rounded plate sits bottom-centre, about 40 percent of frame width, bridging the left text column and the centre tiles. The ground is a soft olive-to-grey vertical gradient.
[Subject]
A woman seated at a desk, photographed waist-up square to the camera, only her eyes visible: a teal-blue hijab draped over head and shoulders, a black cloth covering nose and mouth, a navy garment with an orange floral print beneath. Flat frontal studio light, pale sky-blue seamless background. She fills the right portrait rectangle edge to edge, shoulders clipped by both sides of the panel.
[Headline]
On the white top banner, a bold dark sans headline in title case near-black, centred and nearly full width, reading Expert Data Analysis: Specialized in SPSS and Excel. In the left column, eleven white sans lines in title case each led by a thin white tick, roughly one-eighth of the headline size, listing descriptive statistics, visualisation charts such as bar line histogram and pie, t-tests, chi-square, ANOVA, correlation, regression, reliability, hypothesis testing and business data analysis. On the pale blue plate bottom-centre, two centred lines of bold black sans reading Elevate Your Insights with Expert SPSS and Excel Analysis!
[Badges]
Centre column, upper tile: the Excel mark, a solid green square with a white folded-ribbon glyph and the white word Excel to its right. Lower tile: the IBM SPSS mark, a white square with the blue IBM wordmark across the top, a blue hatch-textured sphere bearing a Greek sigma symbol, and a red SPSS wordmark below. Under the portrait, five short italic red lines on white each with a red tick, reading trust phrases such as 24/7 Available, Reasonable Prices, Customer Satisfaction, Customized Solutions and Clear Reporting.
[Mood]
Olive green, pale blue and institutional green with red italic accents; plain-spoken and service-listing rather than slick. At thumbnail size the white banner, the green Excel tile and the faceless portrait are the strongest shapes.](https://files.posterlet.com/assets/generated/md/jdt5qtevrc3x.webp)
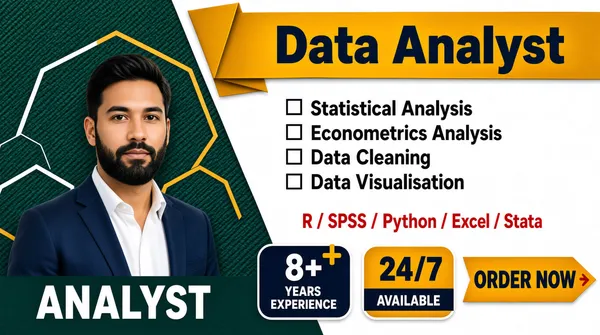
![[Format]
Landscape 16:9 gig cover, flat corporate layout with one photographic cut-out and cut-paper ribbon shapes. Crisp vector edges, light paper texture on the dark panel. No watermark, no personal names.
[Layout]
The frame splits diagonally: the left third is a dark green-blue panel with a fine diagonal weave, and the right two-thirds is a plain white panel whose left edge is a hard slant running from the top-centre down to the lower-left. A wide amber ribbon banner lies across the top of the white panel, its left end cut into a folded tab that overlaps the dark panel, spanning roughly the right two-thirds of the width. On the white panel below the banner, four checklist rows stack down the upper half, then one tool line, then a row of three separate chip shapes spread across the lower area. On the dark panel the subject photograph sits low and to the left, with a large amber and white hexagon outline rising behind his head, and a bold white label directly under him.
[Subject]
A bearded man in his early thirties with dark hair, wearing a navy blue blazer over an open-collar white shirt, cropped at the chest, angled three-quarter toward viewer-right, neutral calm expression. Even soft frontal light, sharp cut-out, no backdrop. He occupies the lower-left third, head at the vertical middle, shoulders touching the left frame edge and the slanted divider behind him. Directly under him sits a bold white all-caps personal first-name label roughly seven characters wide.
[Headline]
Across the amber ribbon, a very heavy dark navy sans headline in all caps reading Data Analyst, centred, about one-tenth of frame height. On the white panel, four title-case black sans lines each led by a small black outlined square tick, reading statistical analysis, econometrics analysis, data cleaning and data visualisation. Below them, one centred red sans line listing tool names separated by slashes. Under the subject, the bold white all-caps first-name label on the dark panel.
[Badges]
Lower-right, three chip badges in a row: a dark navy tablet reading eight-plus years experience with an amber plus sign above the numeral, an amber tablet reading 24 divided by 7 available with a dark bar across it, and an amber arrow-ended ribbon reading ORDER NOW in navy caps. The tool names R, SPSS, Python, Excel and Stata appear as plain slashed red type on the white panel.
[Mood]
Forest teal-green, amber-gold and white with a red accent; tidy, commercial and seller-forward. At thumbnail size the amber ribbon headline, the hexagon-backed portrait and the ORDER NOW ribbon anchor the read.](https://files.posterlet.com/assets/generated/md/9924ey0fqqh9.webp)
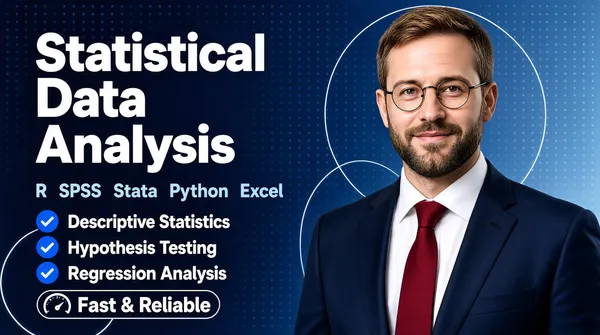
![[Format]
Landscape 16:9 gig cover, modern gradient corporate slide with a photographic cut-out. Soft studio finish, feathered edges. No watermark, no personal names.
[Layout]
A blue gradient field runs across the frame from deep navy at the left to a lighter steel blue at the right, dotted with a faint pale grid of small dots and one large thin white circle outline at the top-right plus another at the lower-left. The left half carries the whole text stack: three stacked headline words on separate lines, a subtitle line, three checklist rows and one outlined capsule, all left-aligned and stacked with generous leading. The right half holds the subject cut-out, which begins around the vertical centre line and bleeds off the right frame edge. The photograph is feathered into the gradient along its left side so the man emerges from the field rather than sitting on a panel. A thin white circular arc sweeps behind his shoulder.
[Subject]
A man in his mid-thirties, short light-brown hair, neat beard, round wire-rimmed glasses, wearing a navy suit over a white shirt with a deep red tie, three-quarter turned to face camera, slight smile, cropped at mid-torso. Bright soft key light from the front-left with cool ambient fill, no props. He occupies the right 45 percent of the frame, lapel and shoulder crossing the centre line.
[Headline]
Left side, three stacked lines of extremely heavy white sans in title case reading Statistical, Data, Analysis, each line about one-sixth of frame height, tight leading, left-aligned. Beneath, one line of medium-weight light steel-blue sans listing the tools R, SPSS, Stata, Python and Excel with wide spacing. Below that, three rows of white medium sans checklist copy each led by a blue filled circular check icon, covering descriptive statistics, hypothesis testing and regression analysis. At the bottom of the stack, a thin white outlined pill capsule reading a short reassurance phrase in white sans, with a small circular speedometer icon at its left inside the capsule.
[Badges]
Three blue filled circular check badges used as list bullets in the left column, and one circular gauge icon inside the bottom capsule. The subtitle types the tool names R, SPSS, Stata, Python and Excel in plain light-blue letterspaced type.
[Mood]
Navy-to-steel-blue gradient with a deep red tie accent; calm, expert and trustworthy. At thumbnail size the stacked white headline and the suited figure are immediately legible.](https://files.posterlet.com/assets/generated/md/hcn7t9tpmagp.webp)
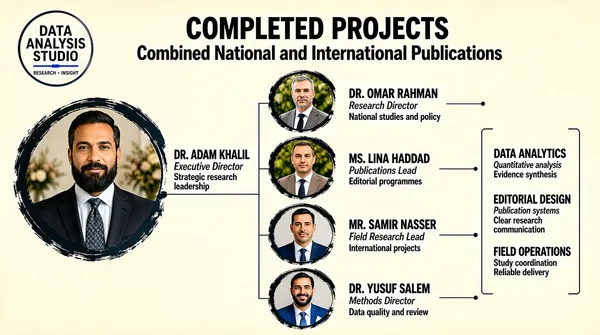
![[Format]
Landscape 16:9 gig cover, corporate team org-chart on a flat cream ground, portraits masked into circles. Print-clean, minimal texture, no panel plates. No watermark, no personal names.
[Layout]
One wide composition on warm parchment cream. Two stacked centred headline lines run across the top band. In the top-left corner sits a circular logo lockup with curved lettering around a small line-art icon. The centre and lower area is a hierarchy tree: one large circle portrait on the left at the vertical middle, joined by thin dark connector rules to four medium circle portraits arranged as a chain — one upper-centre, one dead centre, one lower-centre, one lower-left beneath the big circle — with the rules running vertically between them and one long horizontal rule linking the big circle to the chain. From each medium circle a horizontal rule runs right to a small text block. At the far right two short paired bracket rules group three further role entries in a vertical stack. No boxes or frames are used; the connector rules are the only structure over the cream ground.
[Subject]
Photographs masked into circles with a dark brush-stroke ring painted around each circle. The large left circle holds a bearded man in a dark suit and patterned tie, waist-up, indoors with blurred floral decor behind him. The four medium circles hold men in suits and ties: one in a grey suit against blurred foliage, one in a taupe suit with a dark tie, one in a navy suit and tie, one bearded man in a blue suit with a pocket square. All are straight-on, softly lit, cropped head-and-shoulders inside their circles.
[Headline]
Top centre: one bold black sans line in all caps stating a completed-project count, and beneath it a second slightly smaller bold black line in title case about combined national and international publications. Beside each portrait, a bold all-caps short honorific-plus-name label in black, an italic role line in grey-brown under it, and one or two small dark sans description lines. The right-hand bracket group repeats the same recipe for three further two-word labelled roles, each with an italic specialism and a short description.
[Badges]
Top-left circular lockup: a ring of spaced small-caps letters curving around a blue single-line art icon, over a two-line tagline in tiny letter-spaced caps, reading as a data-analysis studio mark rendered by its typographic recipe only.
[Mood]
Cream, warm taupe and dark slate with muted suit blues; formal, academic and institution-like. At thumbnail size the circular faces and the branching connector rules read as a team hierarchy chart.](https://files.posterlet.com/assets/generated/md/s3dijra5j1ge.webp)